Line Curvature
Overview
This transform calculates the curvature of a 2D line at a specified point. This is useful for analyzing the shape and tortuosity of lines, such as animal trajectories or neuronal processes.
Detailed Description
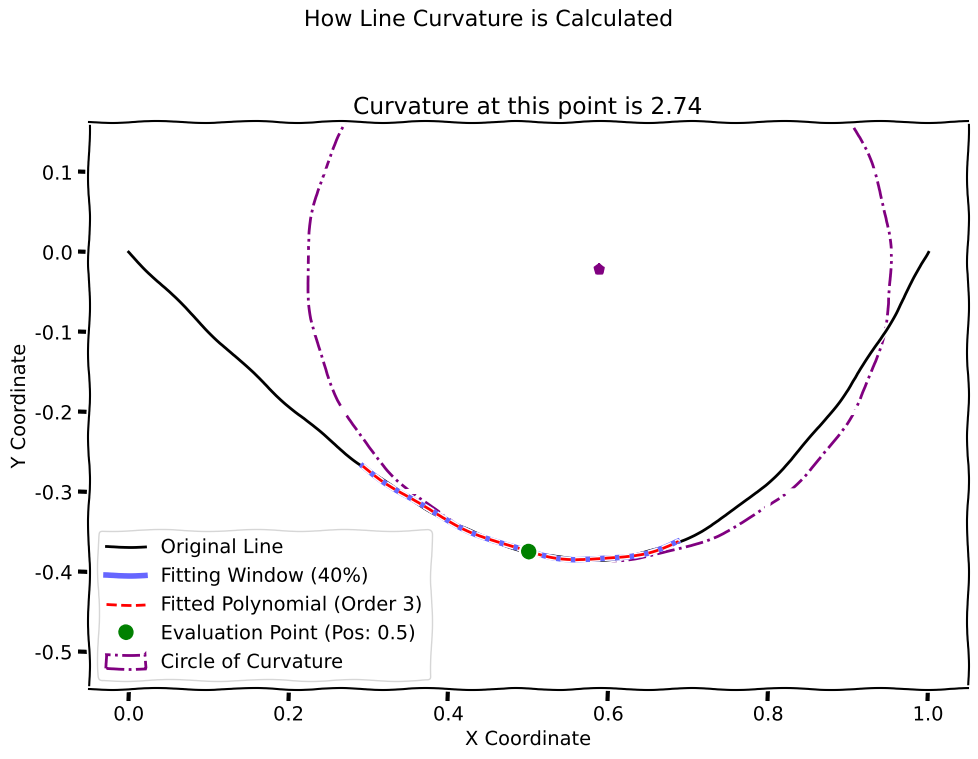
The Line Curvature transform measures how much a line bends at a given point. It does this by fitting a parametric polynomial to the line’s (x, y) coordinates and then calculating the curvature of the fitted polynomial at a user-specified position along the line’s length.
The transform takes a LineData object (representing one or more lines over time) as input and produces an AnalogTimeSeries as output, where each value represents the calculated curvature at the corresponding time point.
This method allows for a smooth and robust estimation of curvature even when the underlying line data is noisy or unevenly sampled.
Neuroscience Use Cases
In neuroscience, analyzing the geometry of paths and structures is crucial for understanding behavior and neural architecture:
- Animal Trajectory Analysis: The curvature of an animal’s path (e.g., a rat in a maze) can reveal changes in exploratory strategy, searching behavior, or the effects of neurological manipulations. High curvature might indicate turning or searching, while low curvature suggests straight-line travel.
- Neuronal Arborization: When analyzing the structure of neurons from microscope images, the curvature of dendrites or axons can be quantified to characterize their branching patterns and complexity. This is important for studying neuronal development, plasticity, and disease.
- Analysis of Saccadic Eye Movements: The trajectory of saccadic eye movements is not perfectly straight. Analyzing the curvature of these paths can provide insights into the underlying motor control mechanisms.
Parameters
This transform has the following parameters:
position: A fractional value between0.0and1.0indicating the point along the line’s total length at which to calculate the curvature.0.0is the start of the line,0.5is the midpoint, and1.0is the end.method: The algorithm to use for calculating curvature. Currently, only one option is available:PolynomialFit: Fits a parametric polynomial to the line data and calculates the analytical curvature.
polynomial_order: The order of the polynomial to fit to the line data. A higher order can capture more complex curves but may be more sensitive to noise. A minimum of 2 is required for curvature calculation.fitting_window_percentage: The percentage (from0.0to1.0) of the total line length to use for the polynomial fit, centered on thepositionparameter. A smaller window focuses the curvature calculation on the local shape, while a larger window provides a more global measure.
Example Configuration
Here is a complete example of a JSON configuration file that could be used to run this transformation. This example calculates the curvature at the midpoint (0.5) of a line, using a 3rd-order polynomial fitted to 10% of the line’s data.
[
{
    "transformations": {
        "metadata": {
            "name": "Line Curvature Pipeline",
            "description": "Test line curvature calculation on a curved line",
            "version": "1.0"
        },
        "steps": [
            {
                "step_id": "1",
                "transform_name": "Calculate Line Curvature",
                "phase": "analysis",
                "input_key": "my_line_data",
                "output_key": "calculated_curvature",
                "parameters": {
                    "position": 0.5,
                    "method": "PolynomialFit",
                    "polynomial_order": 3,
                    "fitting_window_percentage": 0.1
                }
            }
        ]
    }
}
]